

Dr. Pinliang Dong's research on automated measurement of sand dune migration using multi-temporal light detection and ranging (LiDAR) data and GIS is featured on the cover of two most recent issues of International Journal of Remote Sensing (Vol. 36, No. 21 & No. 22, 2015).
Understanding how sand dunes form and change has long been a research topic in Earth and planetary surface processes, and remote sensing has been used for coastal and desert sand dune studies over the past four decades, yet few methods have been developed for automated detection and measurement of dune migration directions and migration rates in large dune fields. It appears that the COSI-Corr (co-registration of optically sensed images and correlation) method developed by Leprince et al. (2007) is the only other method that has been applied to automated detection and measurement of sand dune movement. While the COSI-Corr method does not need elevation data, it does not detect local variations in dune movement, and its accuracy is relatively low when low- or medium-resolution images are used.
In comparison with traditional remote sensing techniques, LiDAR has provided unprecedented datasets for sand dune studies. Using the angle of repose (AOR) as a sensitive movement indicator of barchan (crescent-shaped) and transverse dunes, Dong proposed a PSTP (pairs of source and target points) method to automatically match before and after points on dune slip faces revealed by LiDAR data. An ArcGIS add-in toolbar was also developed using the Python programming language to automate the whole process. The dune migration direction and migration rate at each random point on the centerlines of slip faces are automatically detected, measured, and saved in a GIS database, which allows for further processing and analysis to show dune-field scale patterns of dune migration. Using multi-temporal (January 24, 2009 and June 6, 2010) LiDAR-derived 1-meter resolution digital elevation models (DEMs) for a 9 km by 2.4 km study area in the White Sands Dune Field (WSDF), New Mexico, the ArcGIS add-in can calculate dune migration direction and migration rate for over 10,000 random points in less than 2 minutes. The add-in will be freely available for downloading. Figure 1 and Figure 2 are sample screen shots for the study.
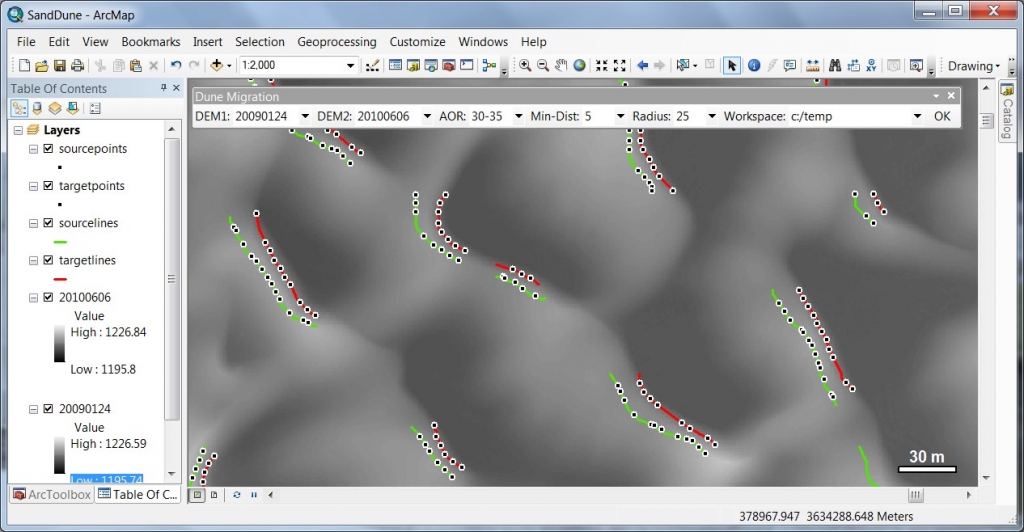
Figure 1. Source points for January 24, 2009 (on green source lines) and target points for June 6, 2010 (on red target lines) are displayed over a 1-meter resolution LiDAR-derived DEM of June 6, 2010. Note that the number of target points does not match the number of source points because some invalid target points have been deleted automatically. Source and target points cannot be generated in areas where slip faces are not detected.
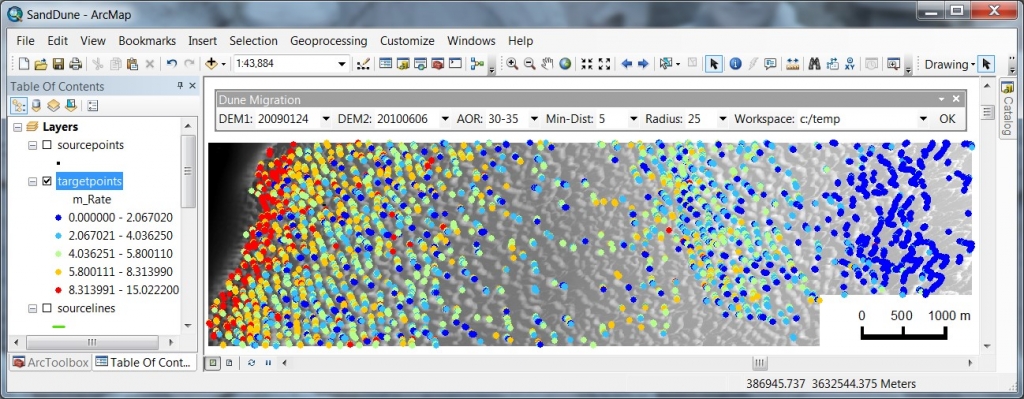
Figure 2. Dune migration rates (m/year) of 8,707 random target points on slip face centerlines in a study area in the White Sands Dune Field, New Mexico.
References:
Dong, P., 2015. Automated measurement of sand dune migration using multi-temporal LiDAR data and GIS. International Journal of Remote Sensing, Vol. 36, No. 21, pp. 5526-5547.
Leprince, S., Barbot, S., Ayoub, F., & Avouac, J., 2007. Automatic and precise orthorectification, coregistration, and subpixel correlation of satellite images, application to ground deformation measurements. IEEE Transactions on Geoscience and Remote Sensing, Vol. 45, No. 6, pp. 1529-1558.